
Decile
Data Segmentation
Used to segment data into 10 groups for comparison. Each group contains 10% of the total data set. 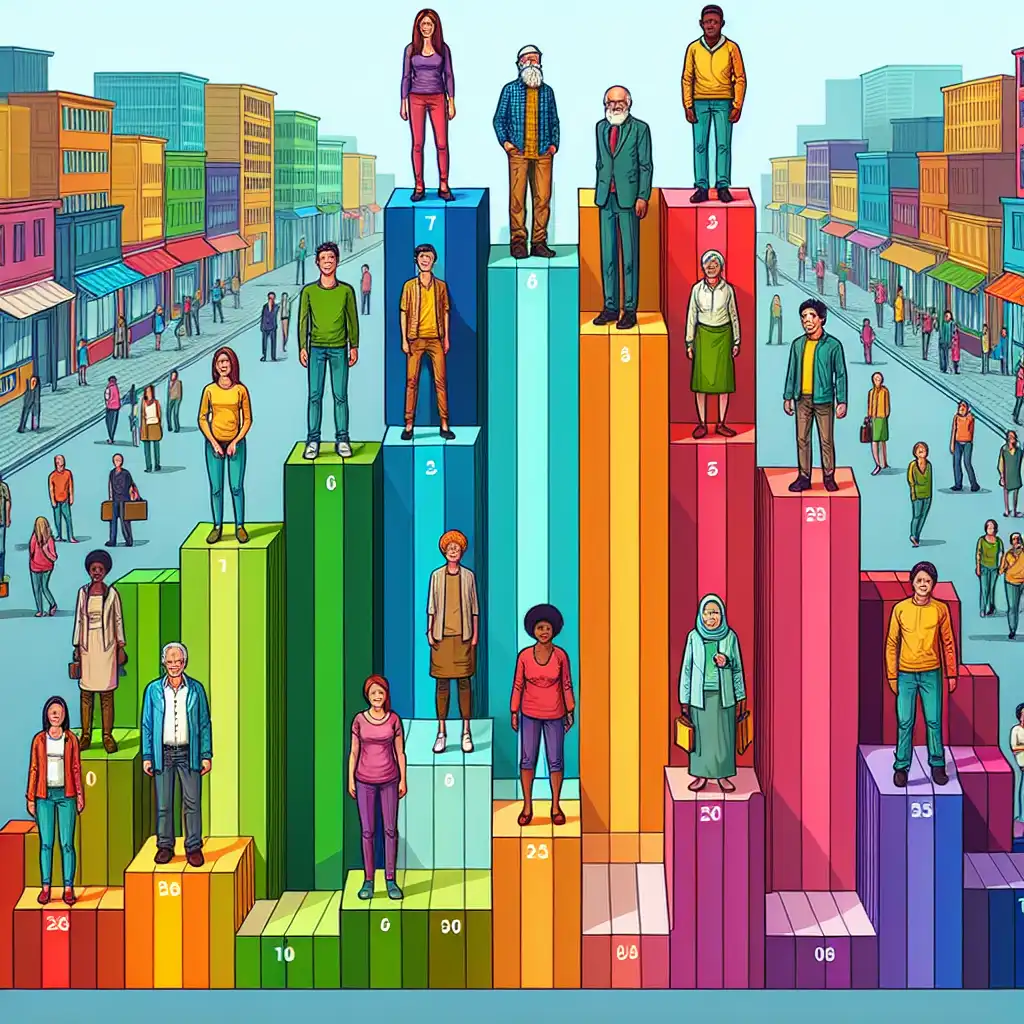 Researchers used deciles to analyze income levels across the population.
Statistical Measure
Reflects position, not value; being in a certain decile doesn't say exactly how much one has.  Despite his wealth, he was in the same decile as others with lower incomes.
Percentile vs. Decile
Remember, deciles divide data into 10 parts, percentiles into 100. Don't confuse the two. 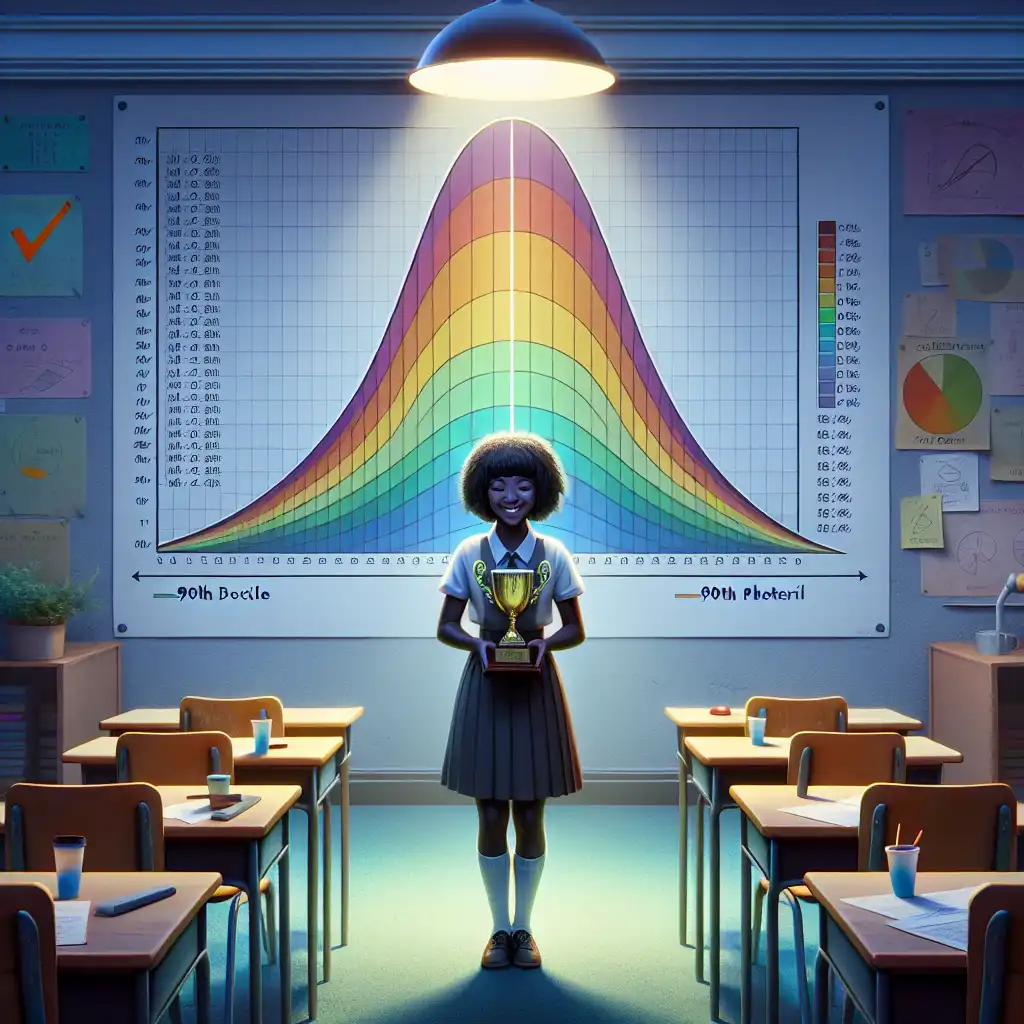 Her score was in the 9th decile, not the 90th percentile.