
Tabulate
Academic Context
Common in research and statistics, where clarity of data presentation is vital.  The economist tabulated demographics alongside employment trends.
Visual Aid
Used when visualizing numbers or categories makes the information easier to understand.  For her presentation, Anna tabulated the sales figures by region.
Clarity First
Helpful for comparing sets of data, or showing relationships between different variables. 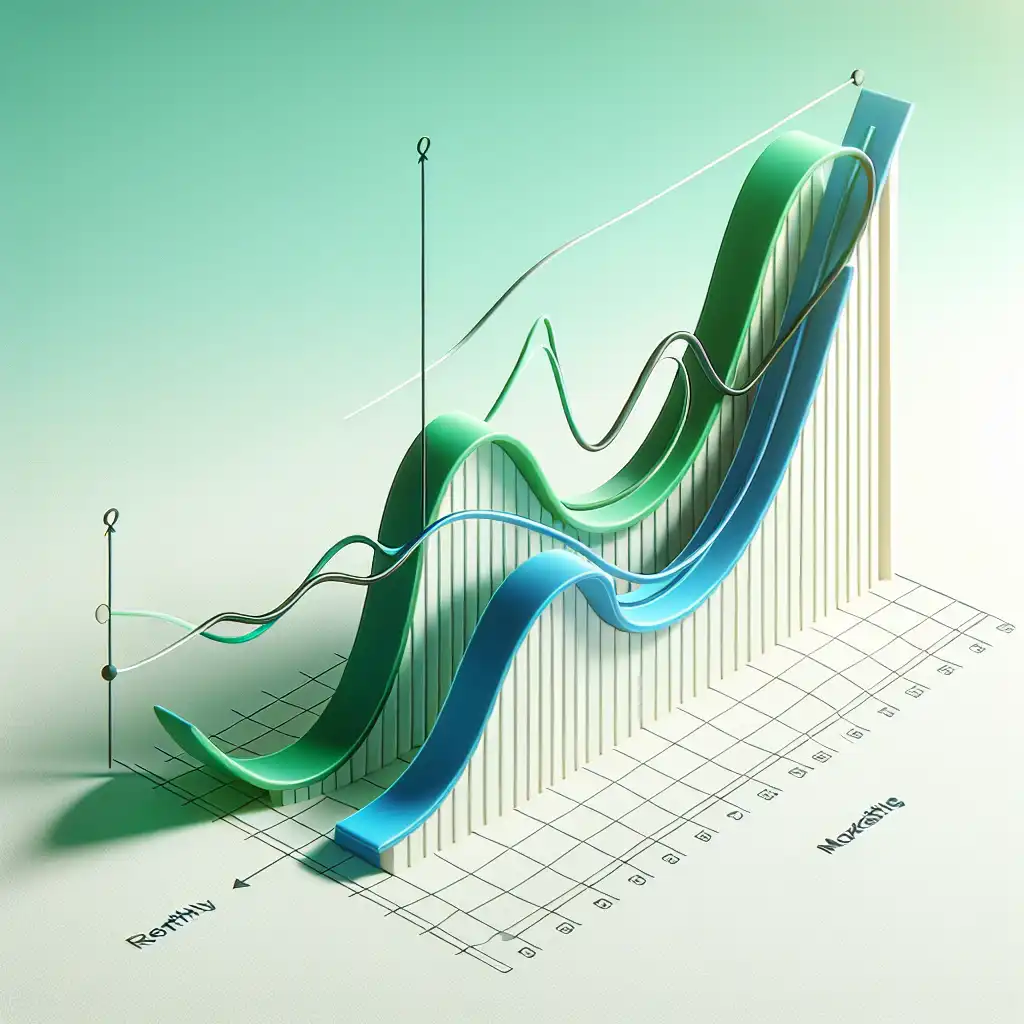 To highlight the trend, Mark tabulated monthly revenue against marketing spend.